
 English
 Español
 Deutsch
 Français
 Italiano
 Português
 Русский
 Türkçe
 العربية
 简体中文
简体中文 日本語
日本語 한국어
한국어 Tiếng Việt
 Bahasa
Territories
50,000+ US Census Demographic Metrics
Colorize your territories based on US Census Bureau’s demographic indicators: population counts, percentages, means, medians
50,000+ Indicators from the American Community Survey
Explore the 50,000+ demographic indicators provided by the US Census Bureau within its 5-year American Community Survey (2020-2024).
- Use any of these metrics to colorize your territories with a configurable color scale.
- Add any number of these metrics to territory names and territory data popups.
Please note that since US Census Bureau publishes data only for specific map areas like states, counties, census tracts, census block groups, be sure to use the Geo-library to mass-create territories based on one of these area types for the demographic data to be available.
Demographic metrics can be combined in one territory group with aggregate and custom metrics. You may also use the Mapsly automation suite to analyze these metrics, perform calculations on them, export them to your CRM or Google Sheets, or send them as SMS or email reports.
Population
Population by age, gender, education, race, language spoken, marital status, disability status, health insurance, mortgage status, and more.
Income & Poverty
Income (total, mean, median) and poverty rate.
Rent
Spending on rent.
Housing
Housing units by type and years built.
Internet
Internet connection types and speed.
Vehicles & Commuting
Vehicles and commuting (means, duration).
How to Add and Use Demographic Metrics
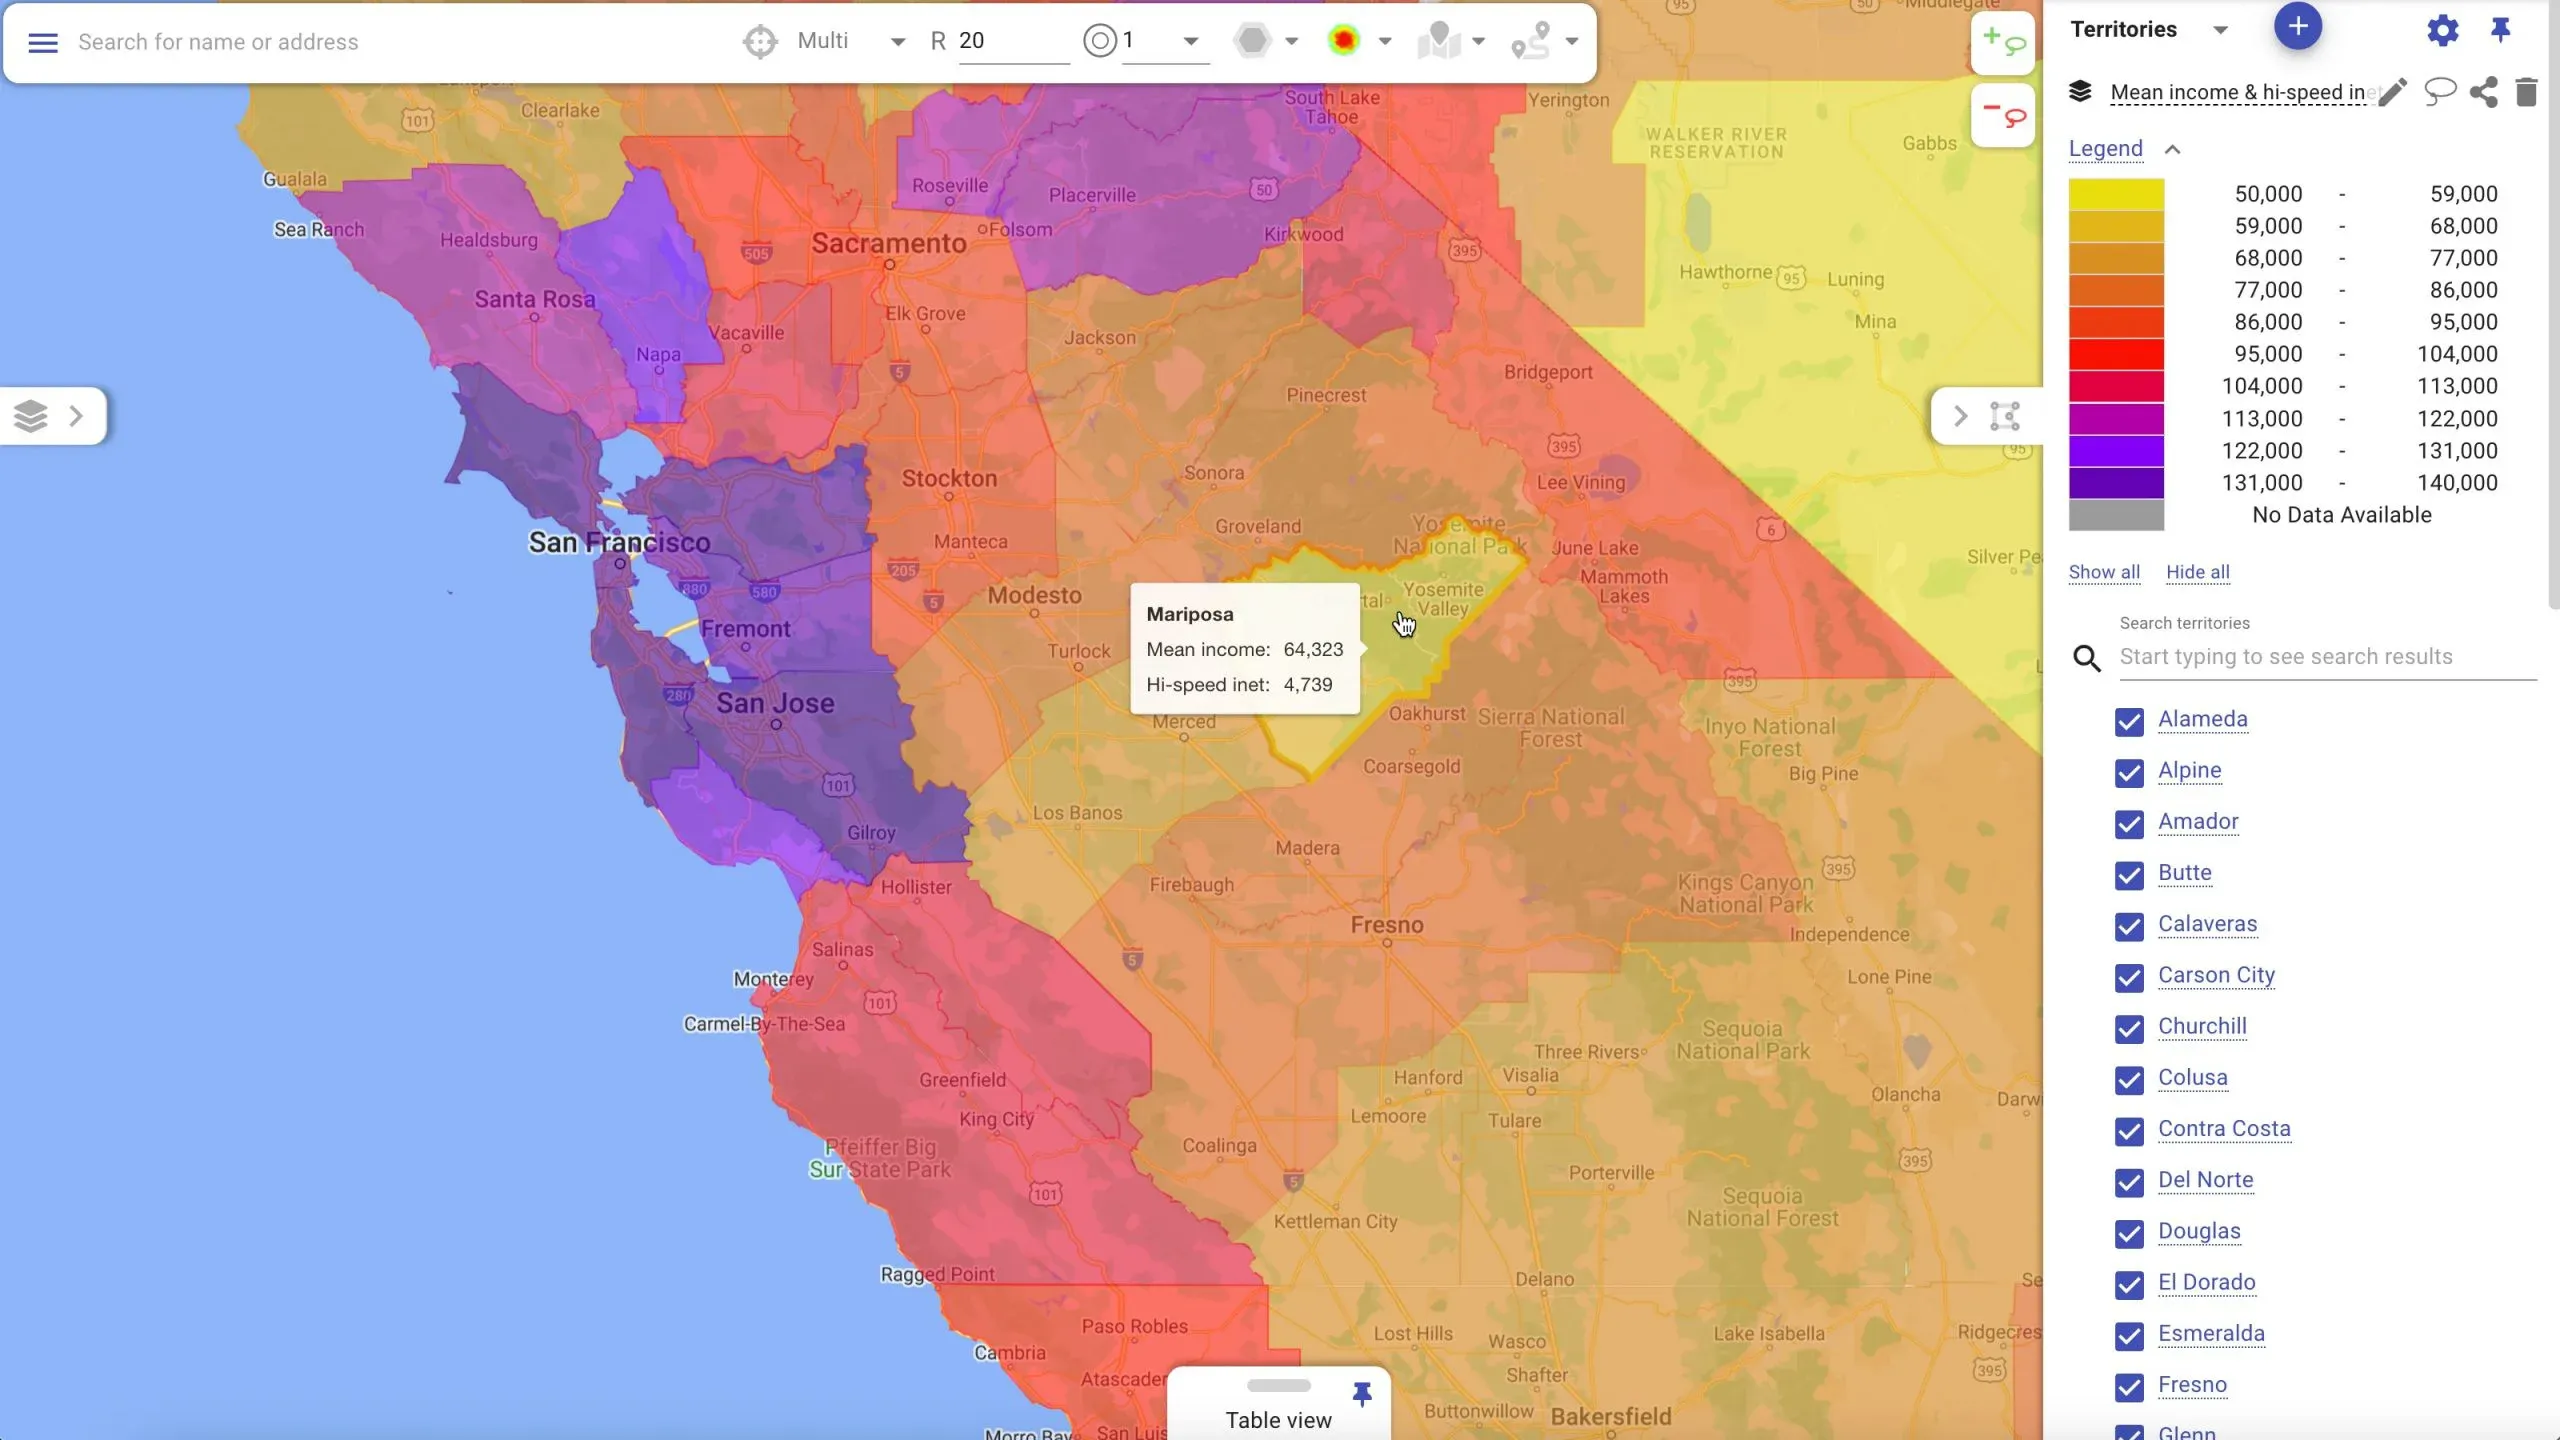
In the example below we will colorize California counties based on their mean household annual income and show this metric in the territory data popup along with the number of households with high-speed Internet connection.
Create a Territory Group and Add Two Metrics
Use the Demographic metric explorer with a powerful context search to add Mean household income and Households with high-speed Internet metrics.
Click Folder icon in Context search to find the metric in Hierarchy — to explore adjacent metrics.
Use Metrics in Territory Color, Name & Popup
Activate colorization based on Mean income, add it to the territory name, and then add both metrics to the territory data popup.
Select Counties Using Geo-Library
Use Geo-library to select counties that you’d like to convert to territories.
View Your Territories & Their Metrics
View colorized counties. Hover over a county to view values of both metrics in its data popup.
Disclaimer
Mapsly uses the US Census Bureau Data API but is not endorsed or certified by the Census Bureau.
Go Deeper
Help Center Guides
- Demographic metrics explorer
- Territory groups
- Territory group properties, data fields, aggregate metrics, and demographics
- How to create territories using the geo-library
- How to configure auto-assignment of territories and saving of assigned territories to the CRM
- Territory properties and shape editor
- How to share territories, as well as map layers, filters and saved places with other users and user profiles
Ready to Get Started?
Start a free 14-day trial of the full platform, or let a solution engineer build a proof of concept for your team.
No credit card required · Chat with sales