Map, Analysis & Editing

Heatmaps

Create heatmaps based on records that meet a condition, weighted by a field value, with a fully adjustable color scale.

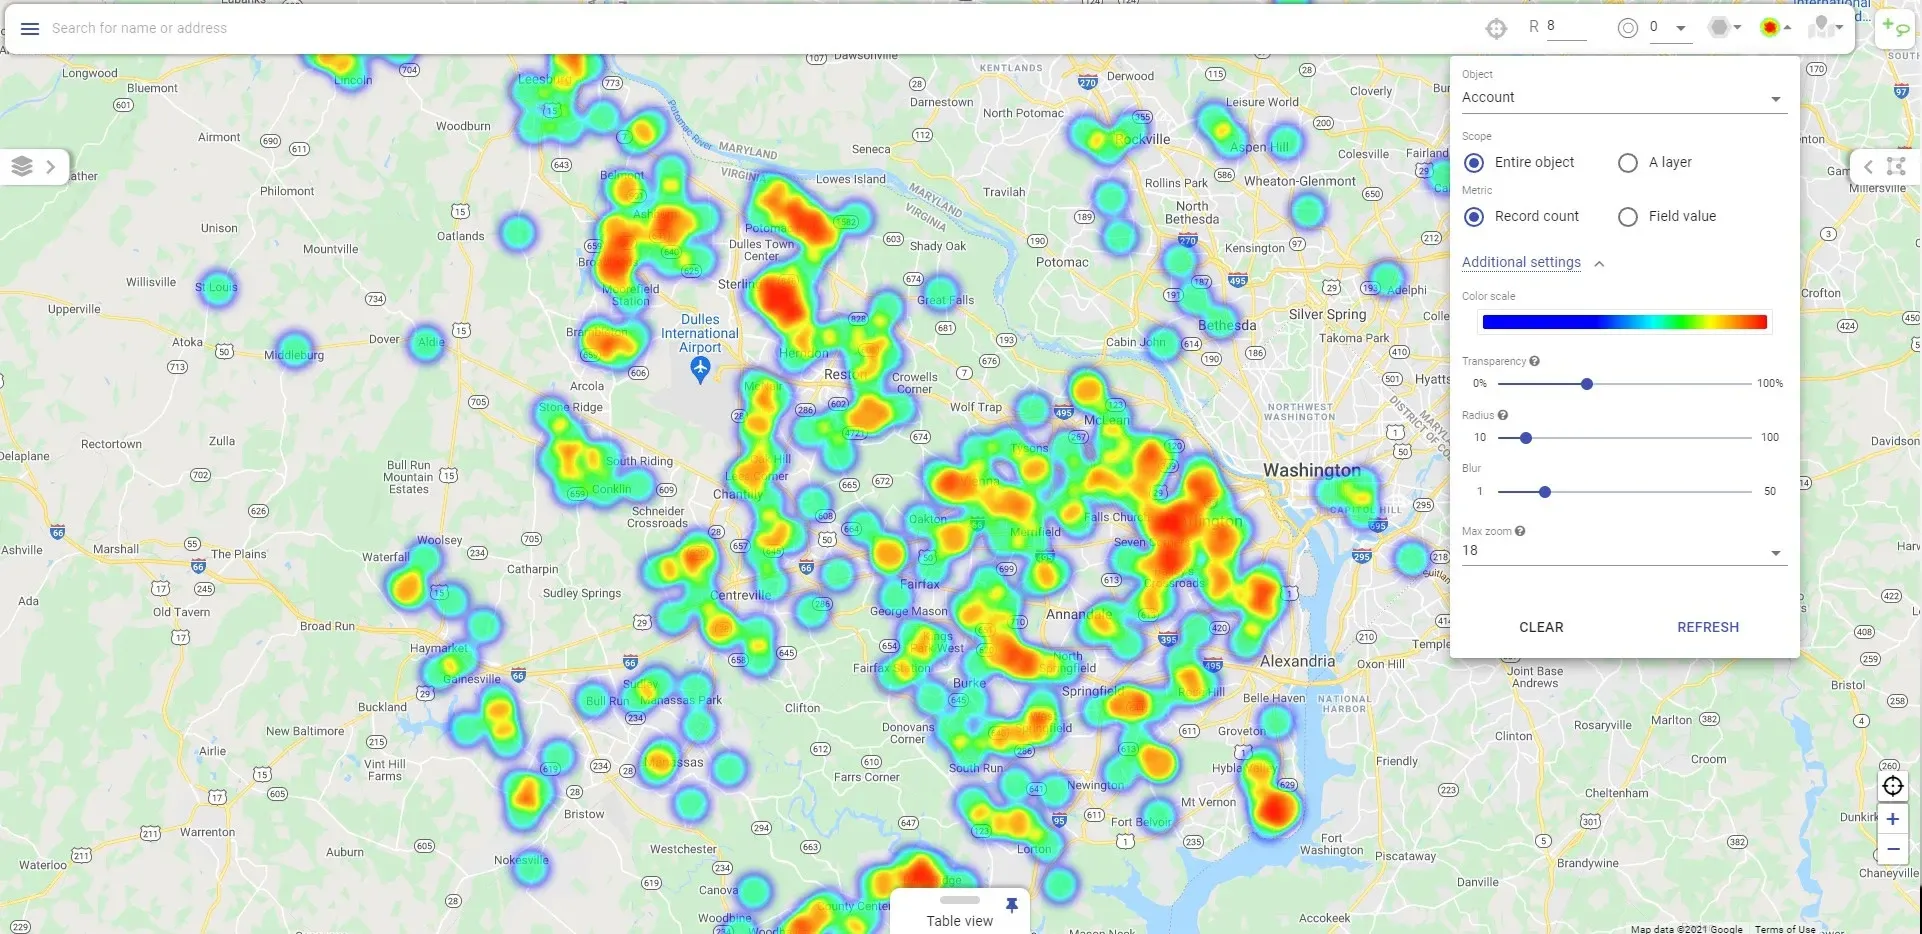
Mapsly heatmap of account density around Washington, DC, and Northern Virginia, with the heatmap settings panel: object, scope, metric, color scale, transparency, radius, blur, and max zoom

Heatmaps Based on the Density of Records

Build a heatmap based on the density of records, with adjustable visualization parameters, including the color scale, blur radius, and transparency.

Records That Meet a Condition, Weighted by Any Field

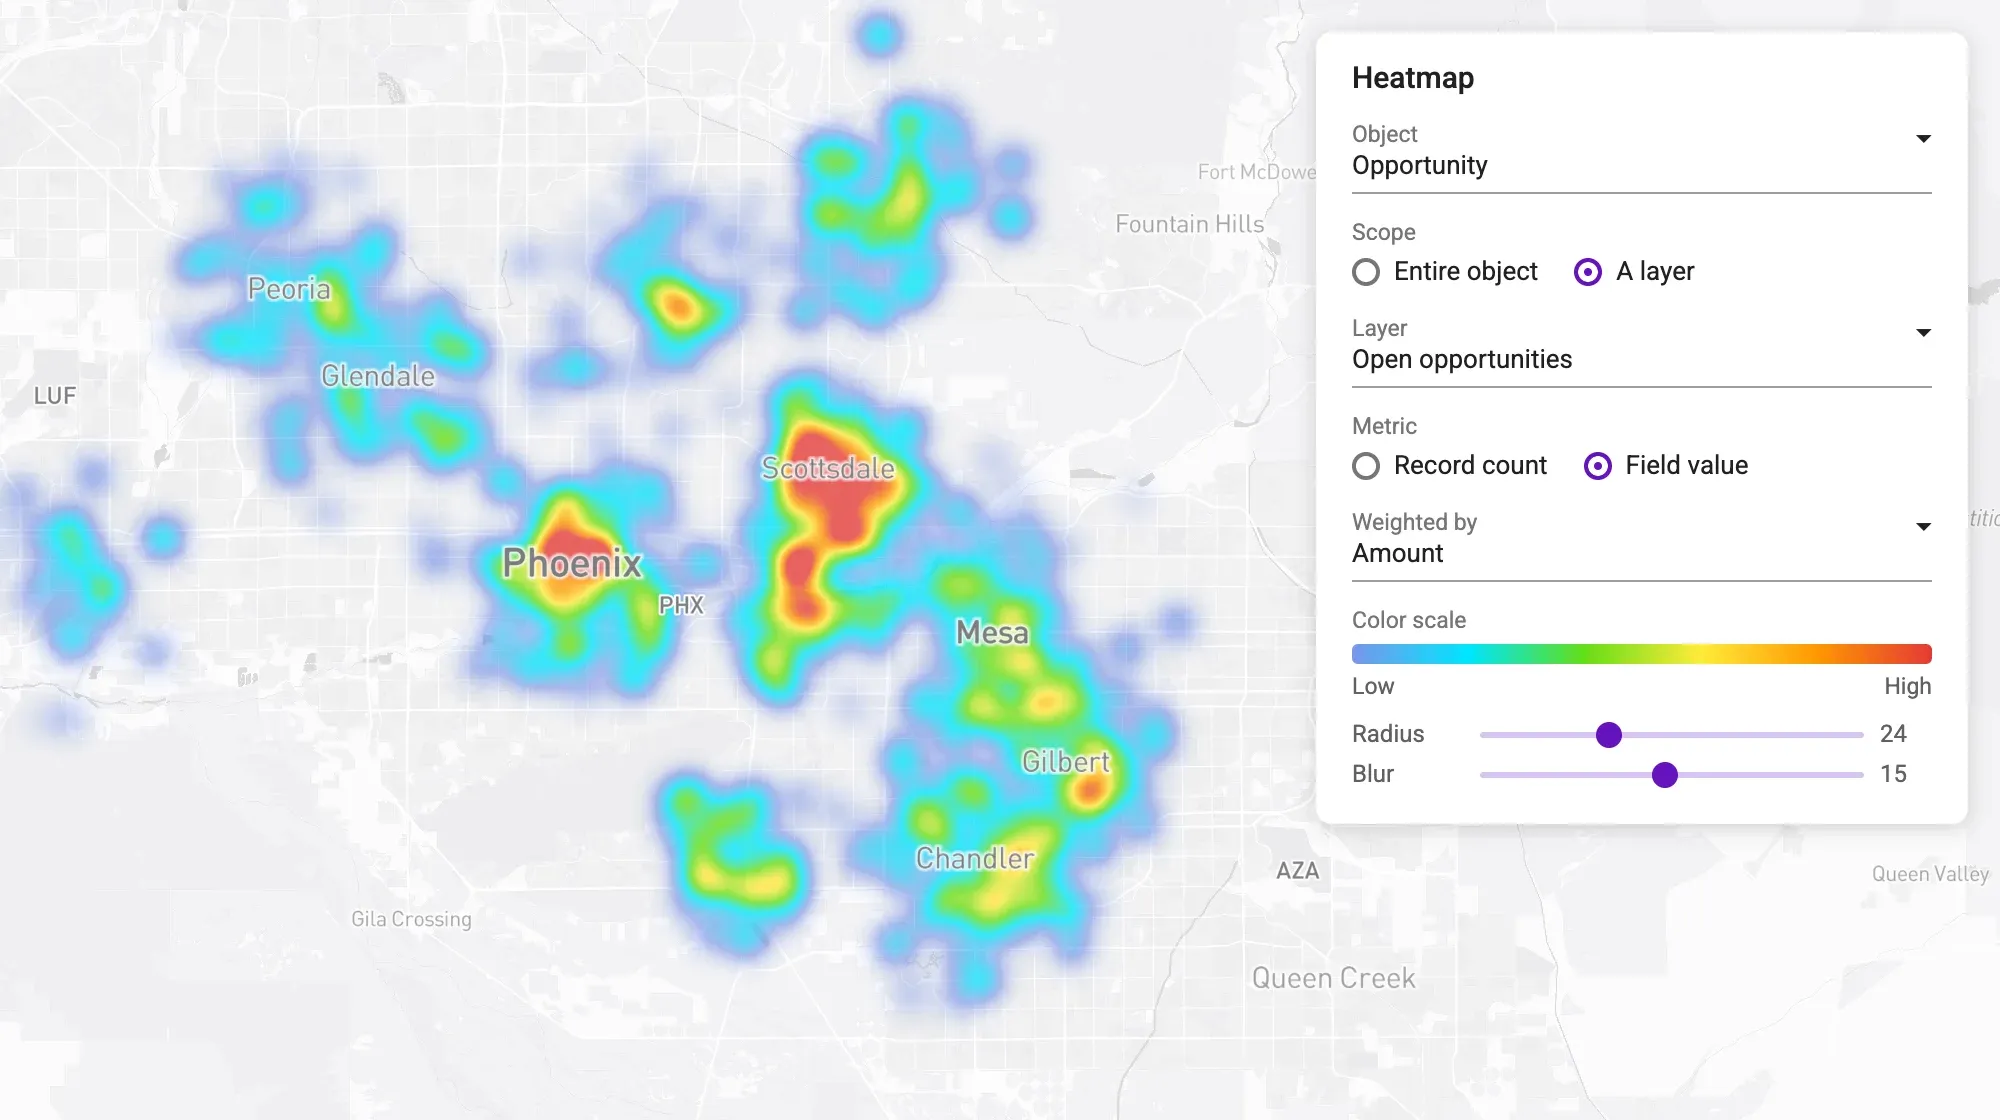
The heatmap may include all records in an object or any of its layers. Create a heatmap based on a layer to include only records that meet a condition.

A heatmap can be weighted by any numeric data field, including a custom one, and normalized by a maximum value.

Heatmap of open opportunities across the Phoenix metro area weighted by the Amount field, with heatmap settings: object Opportunity, scope set to a layer, and metric set to a field value

Customer story

How FELFEL Cuts Planning Time from a Week to a Day—and Doubles Field Efficiency with Mapsly

By eliminating manual route planning, tool-hopping, and error-prone communications, FELFEL streamlined nationwide fridge maintenance, emergency responses, and field coordination—freeing up time for logistics and improving service at scale.

Read the story

Ready to Get Started?

Start a free 14-day trial of the full platform, or let a solution engineer build a proof of concept for your team.

No credit card required · Chat with sales