
 English
 Español
 Deutsch
 Français
 Italiano
 Português
 Русский
 Türkçe
 العربية
 简体中文
简体中文 日本語
日本語 한국어
한국어 Tiếng Việt
 Bahasa
Analytics & dashboards
Geo Intelligence Dashboard
Flexible geospatial dashboard with points, heatmap, grids, charts, and category filters.
- By Mapsly team
- Certified app
- Pro plan
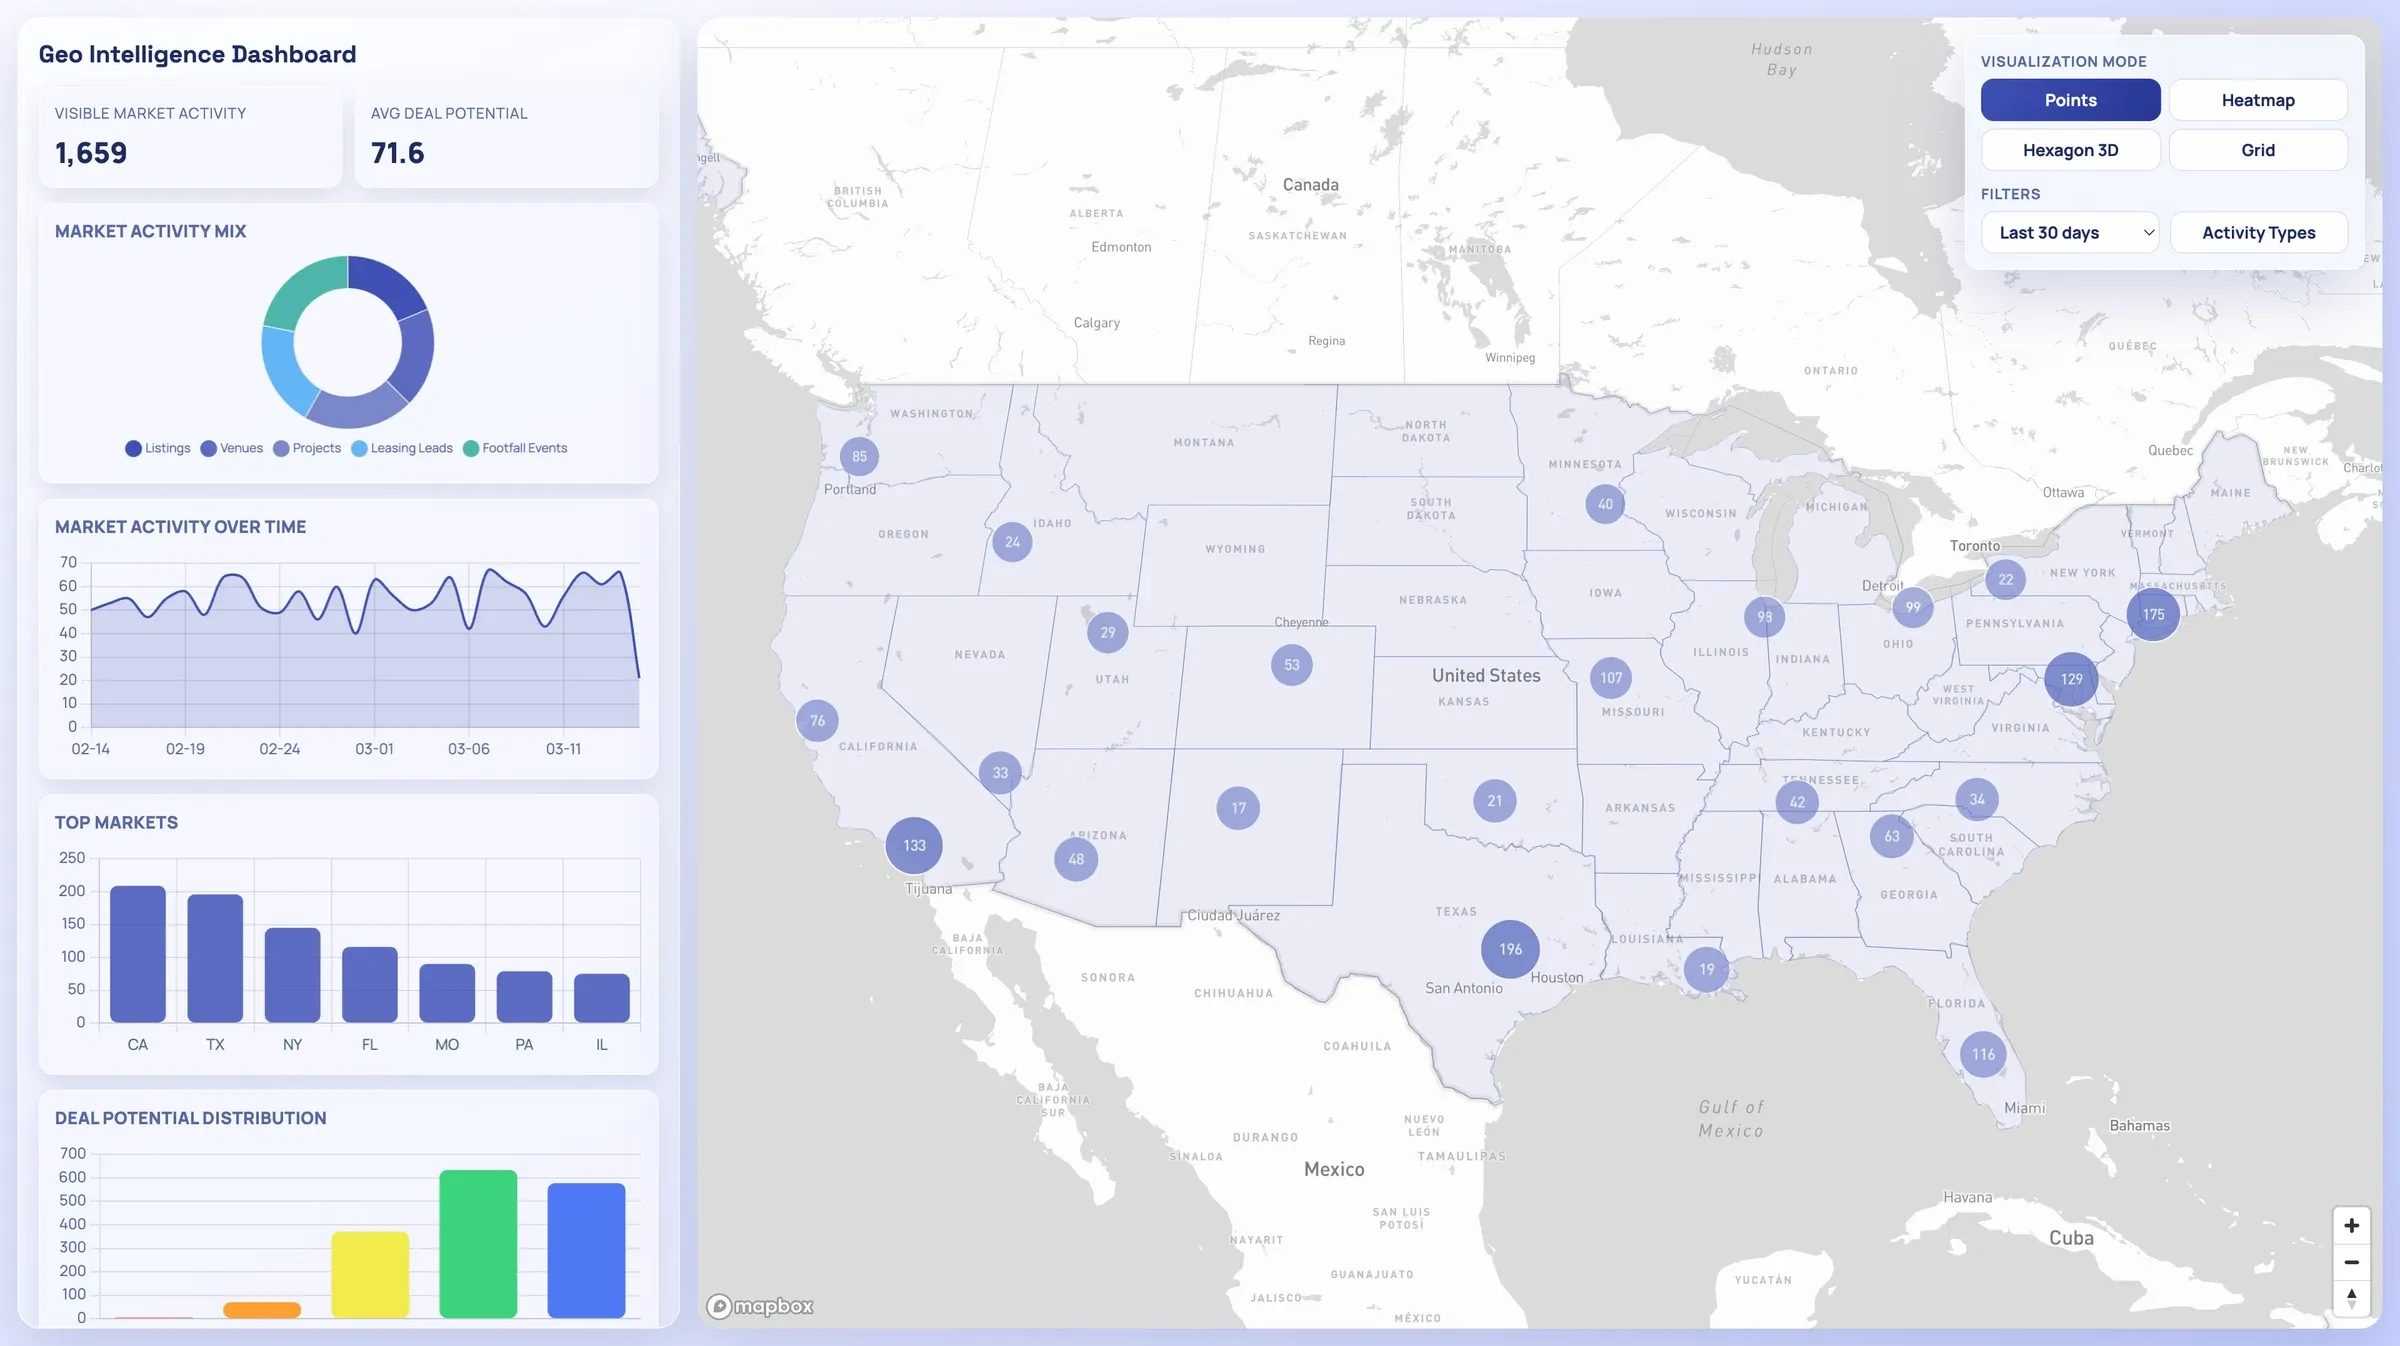
Geo Intelligence Dashboard layers KPI cards, charts, and multiple spatial visualization modes on top of the same activity dataset. It is a flexible foundation for executive geo-analytics and regional performance reviews.
Highlights
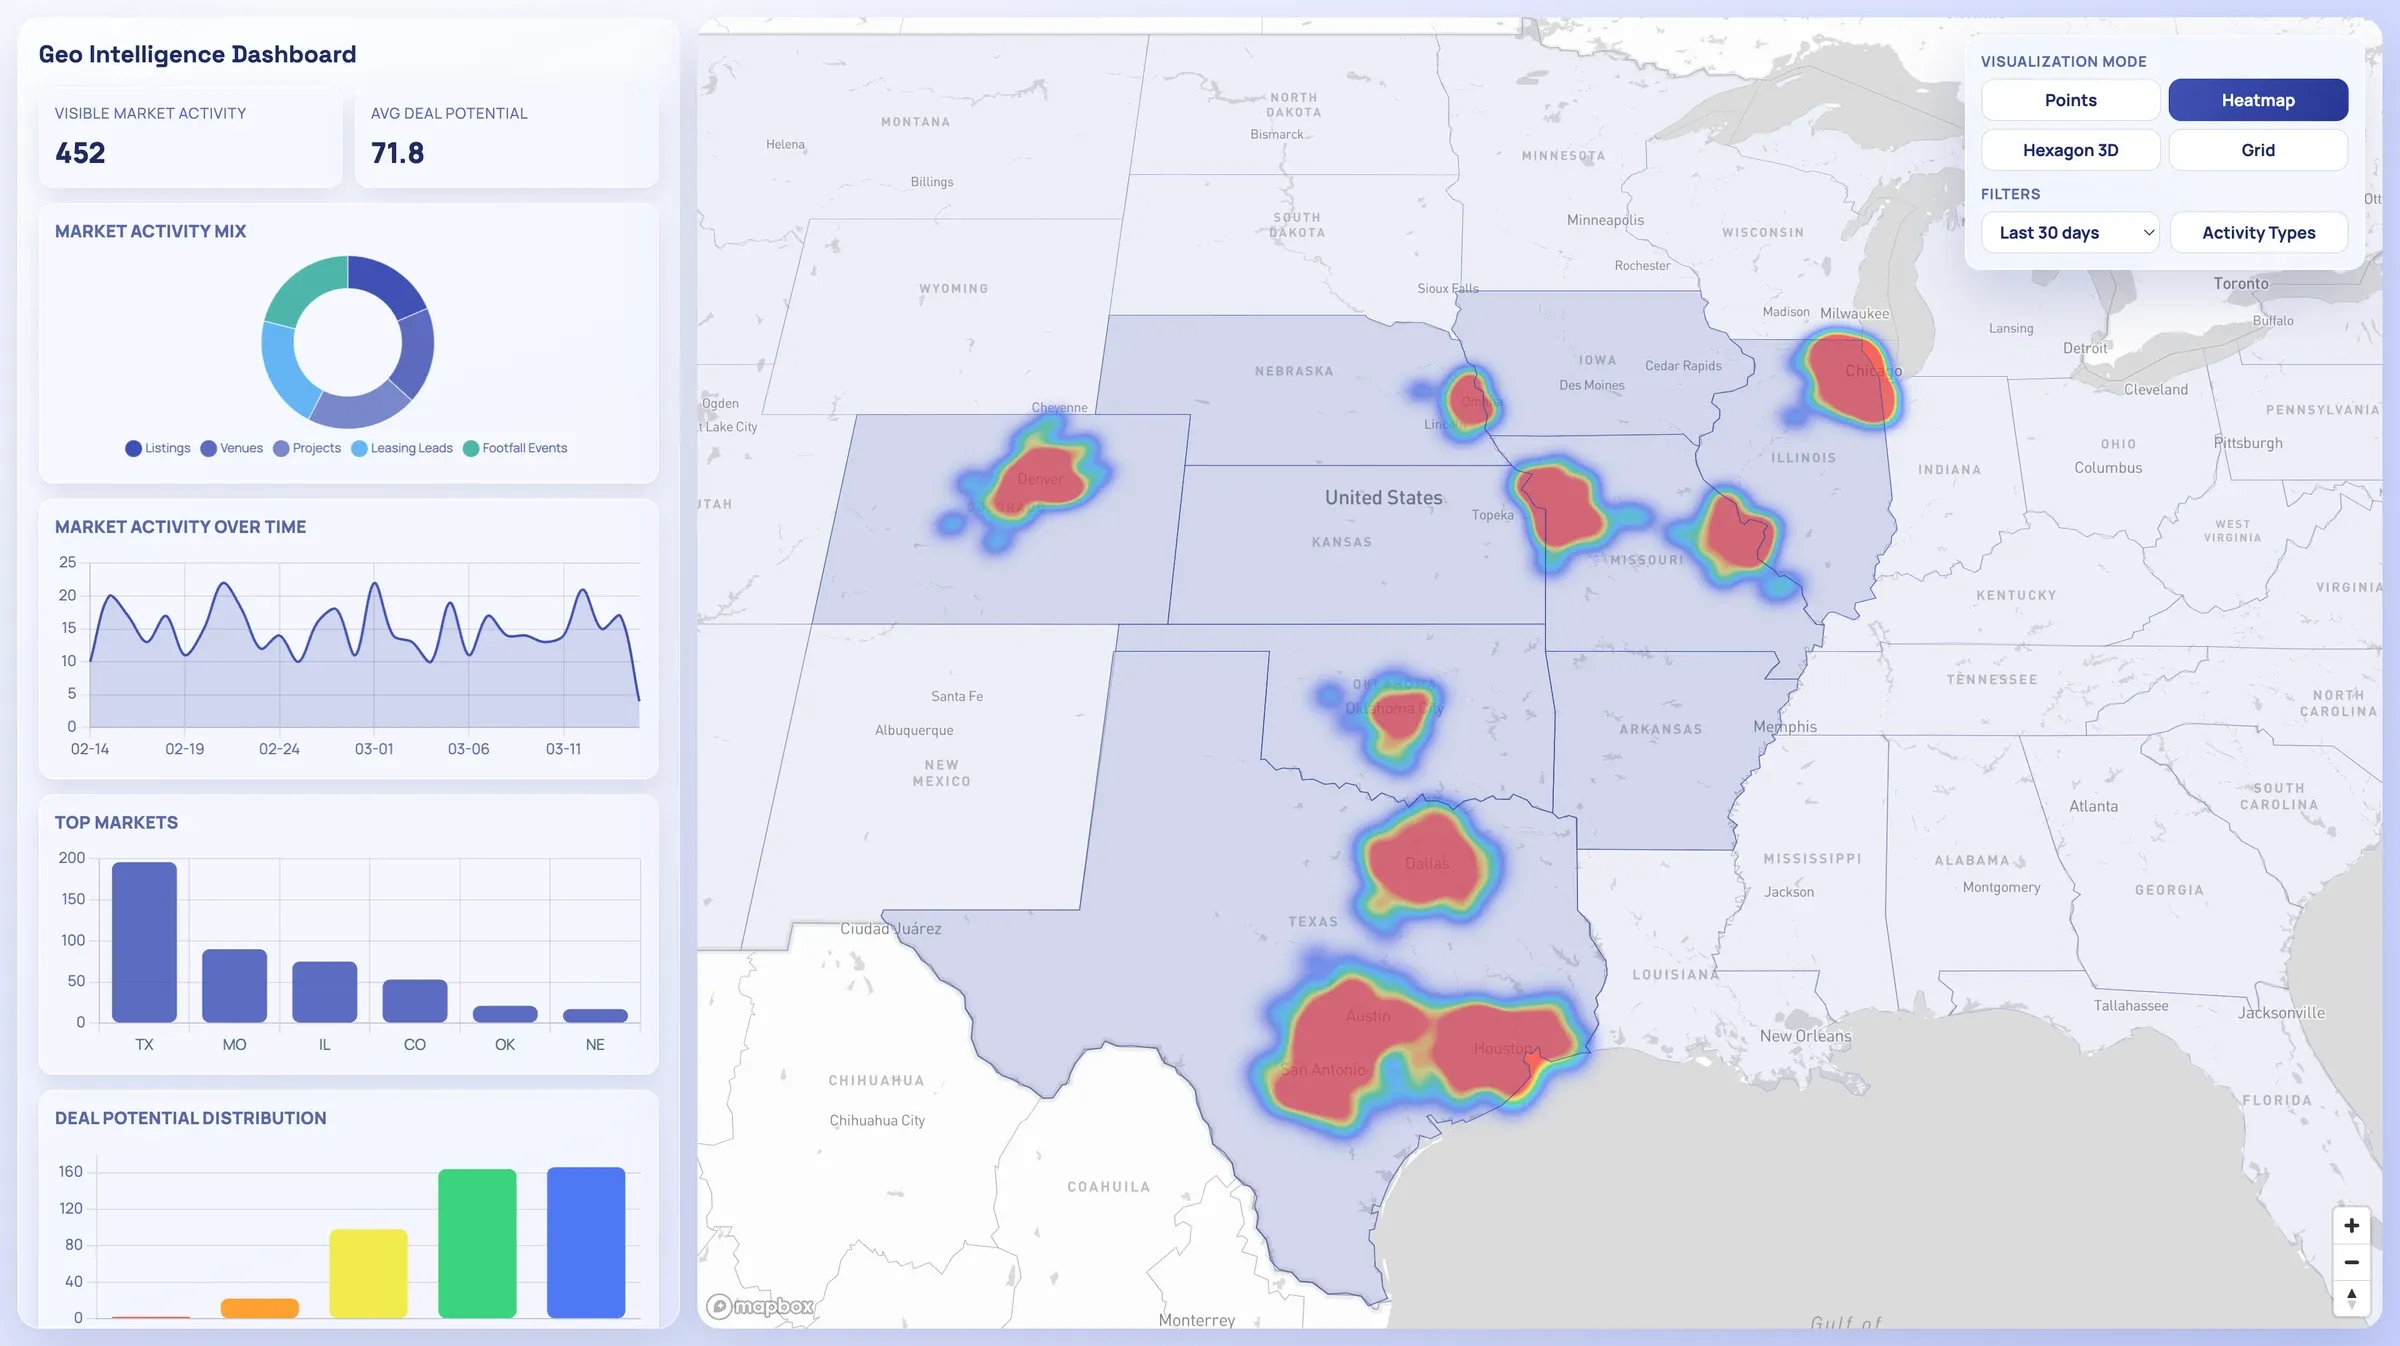
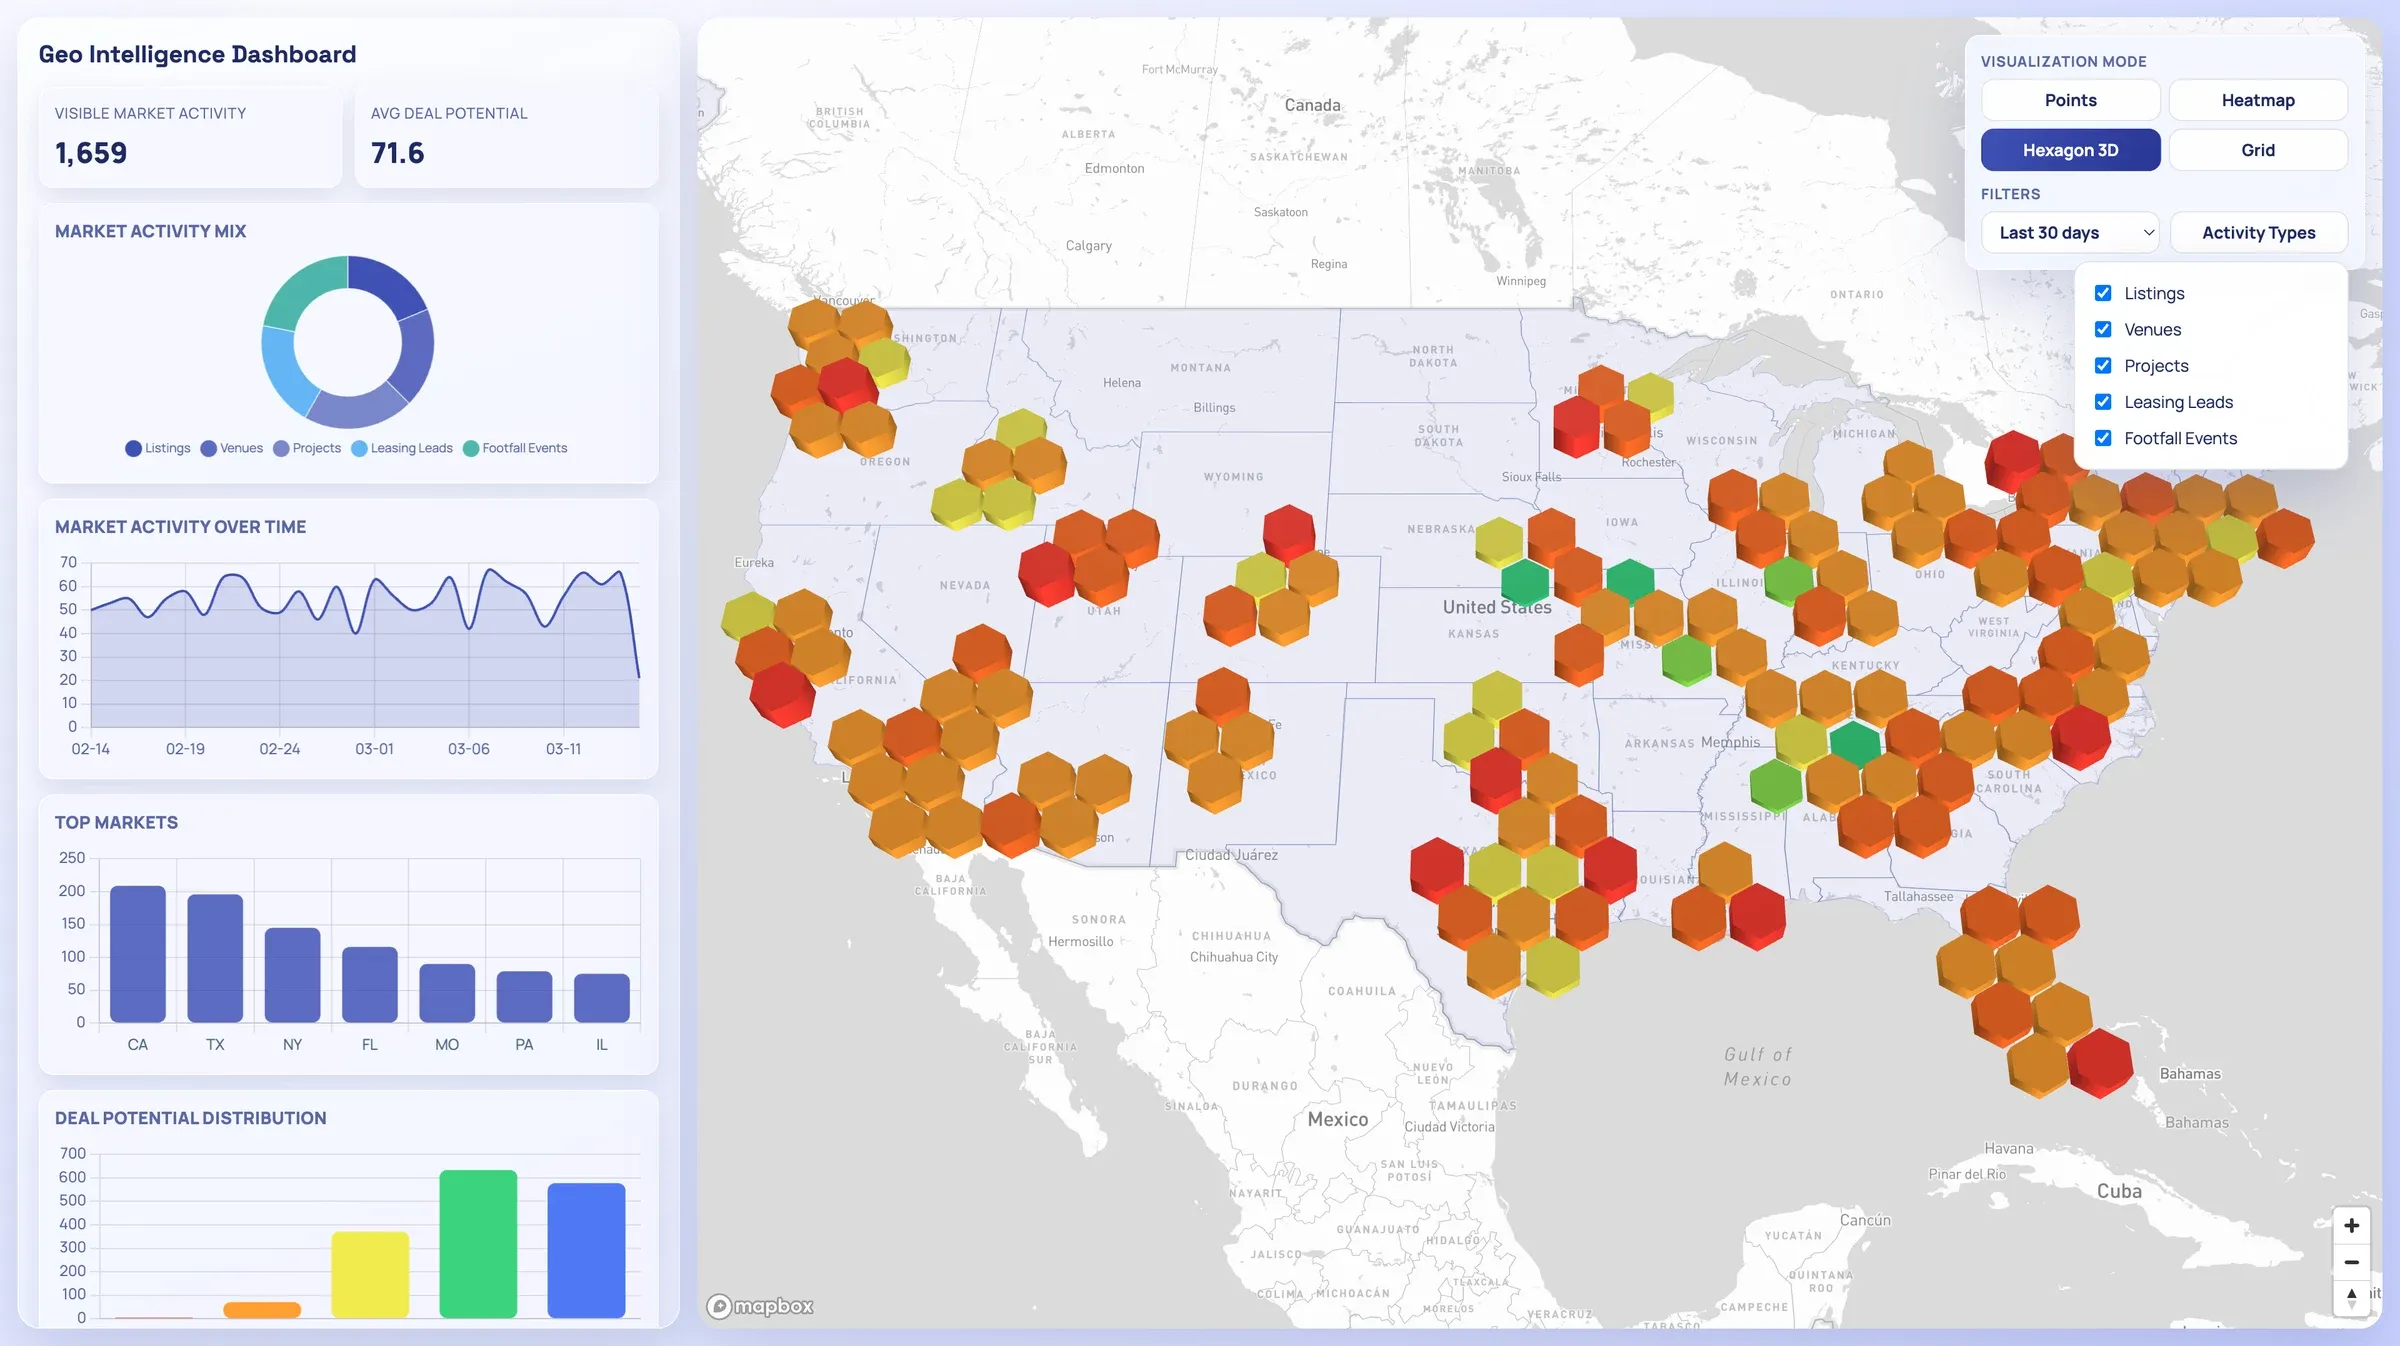
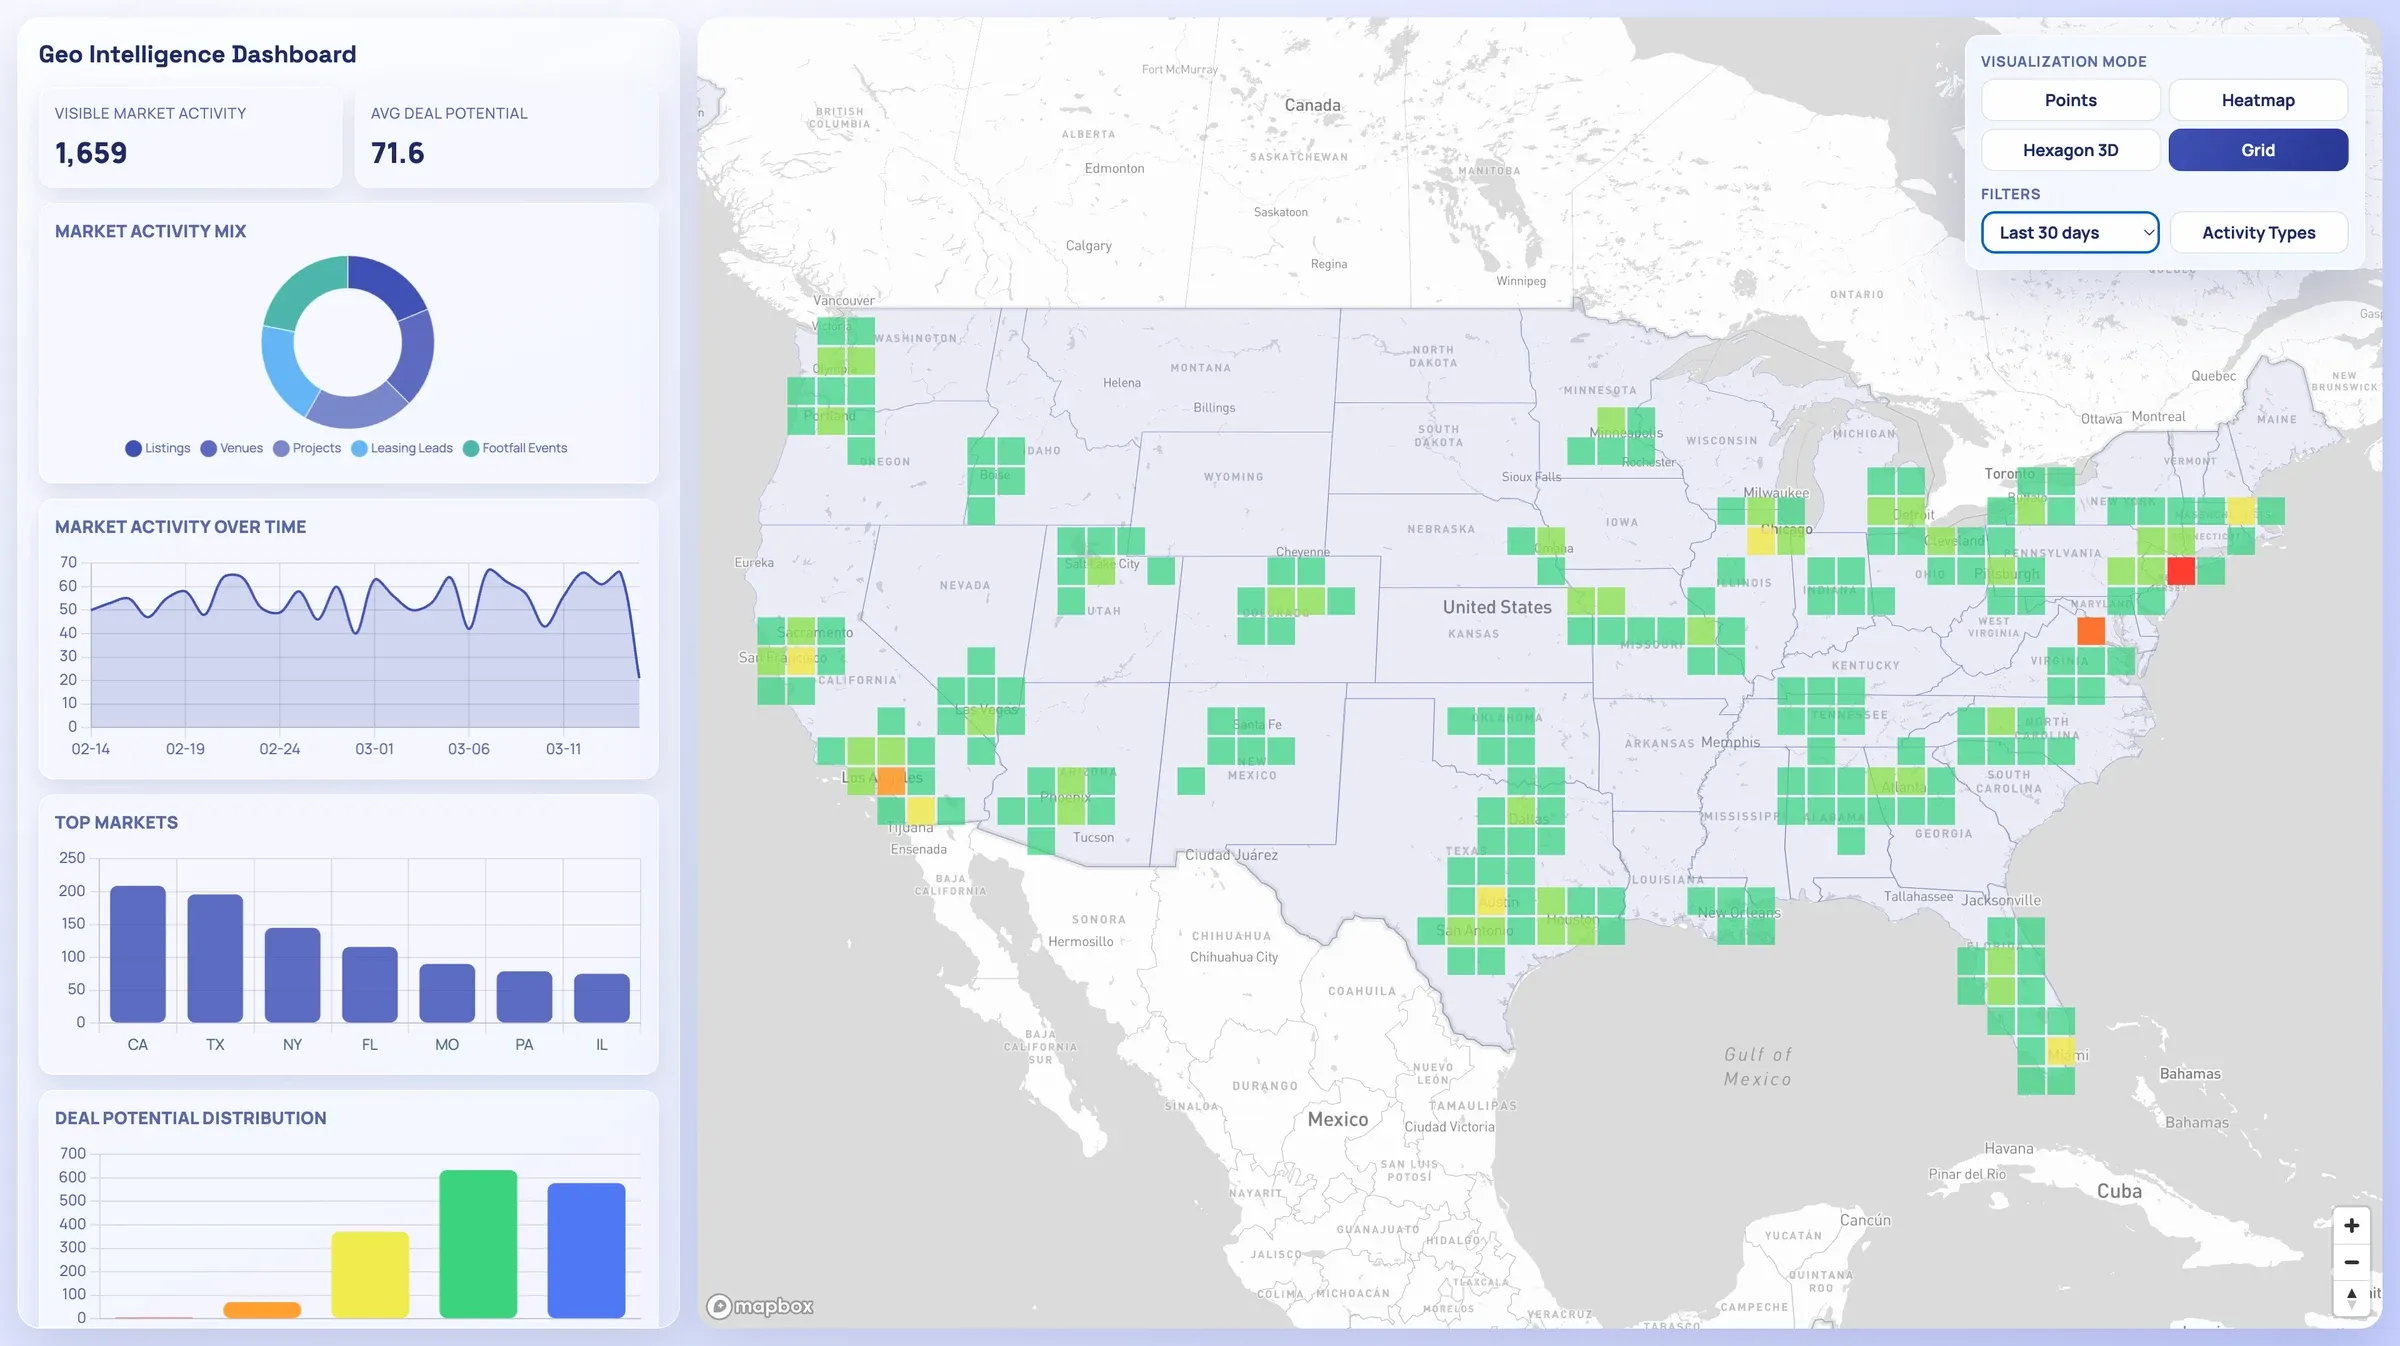
- Multiple spatial views include points, heatmap, hexagon 3D, and grid
- Sidebar charts show category mix, trends, top states, and score distribution
- Category filters let teams isolate activity types quickly
- State-level selection supports regional analysis in one interface
Key Benefits
- Executive geo-analytics foundation
- Flexible visualization modes
- Good for portfolio reviews
- Reusable cross-industry dashboard shell
More Apps
Browse all apps-
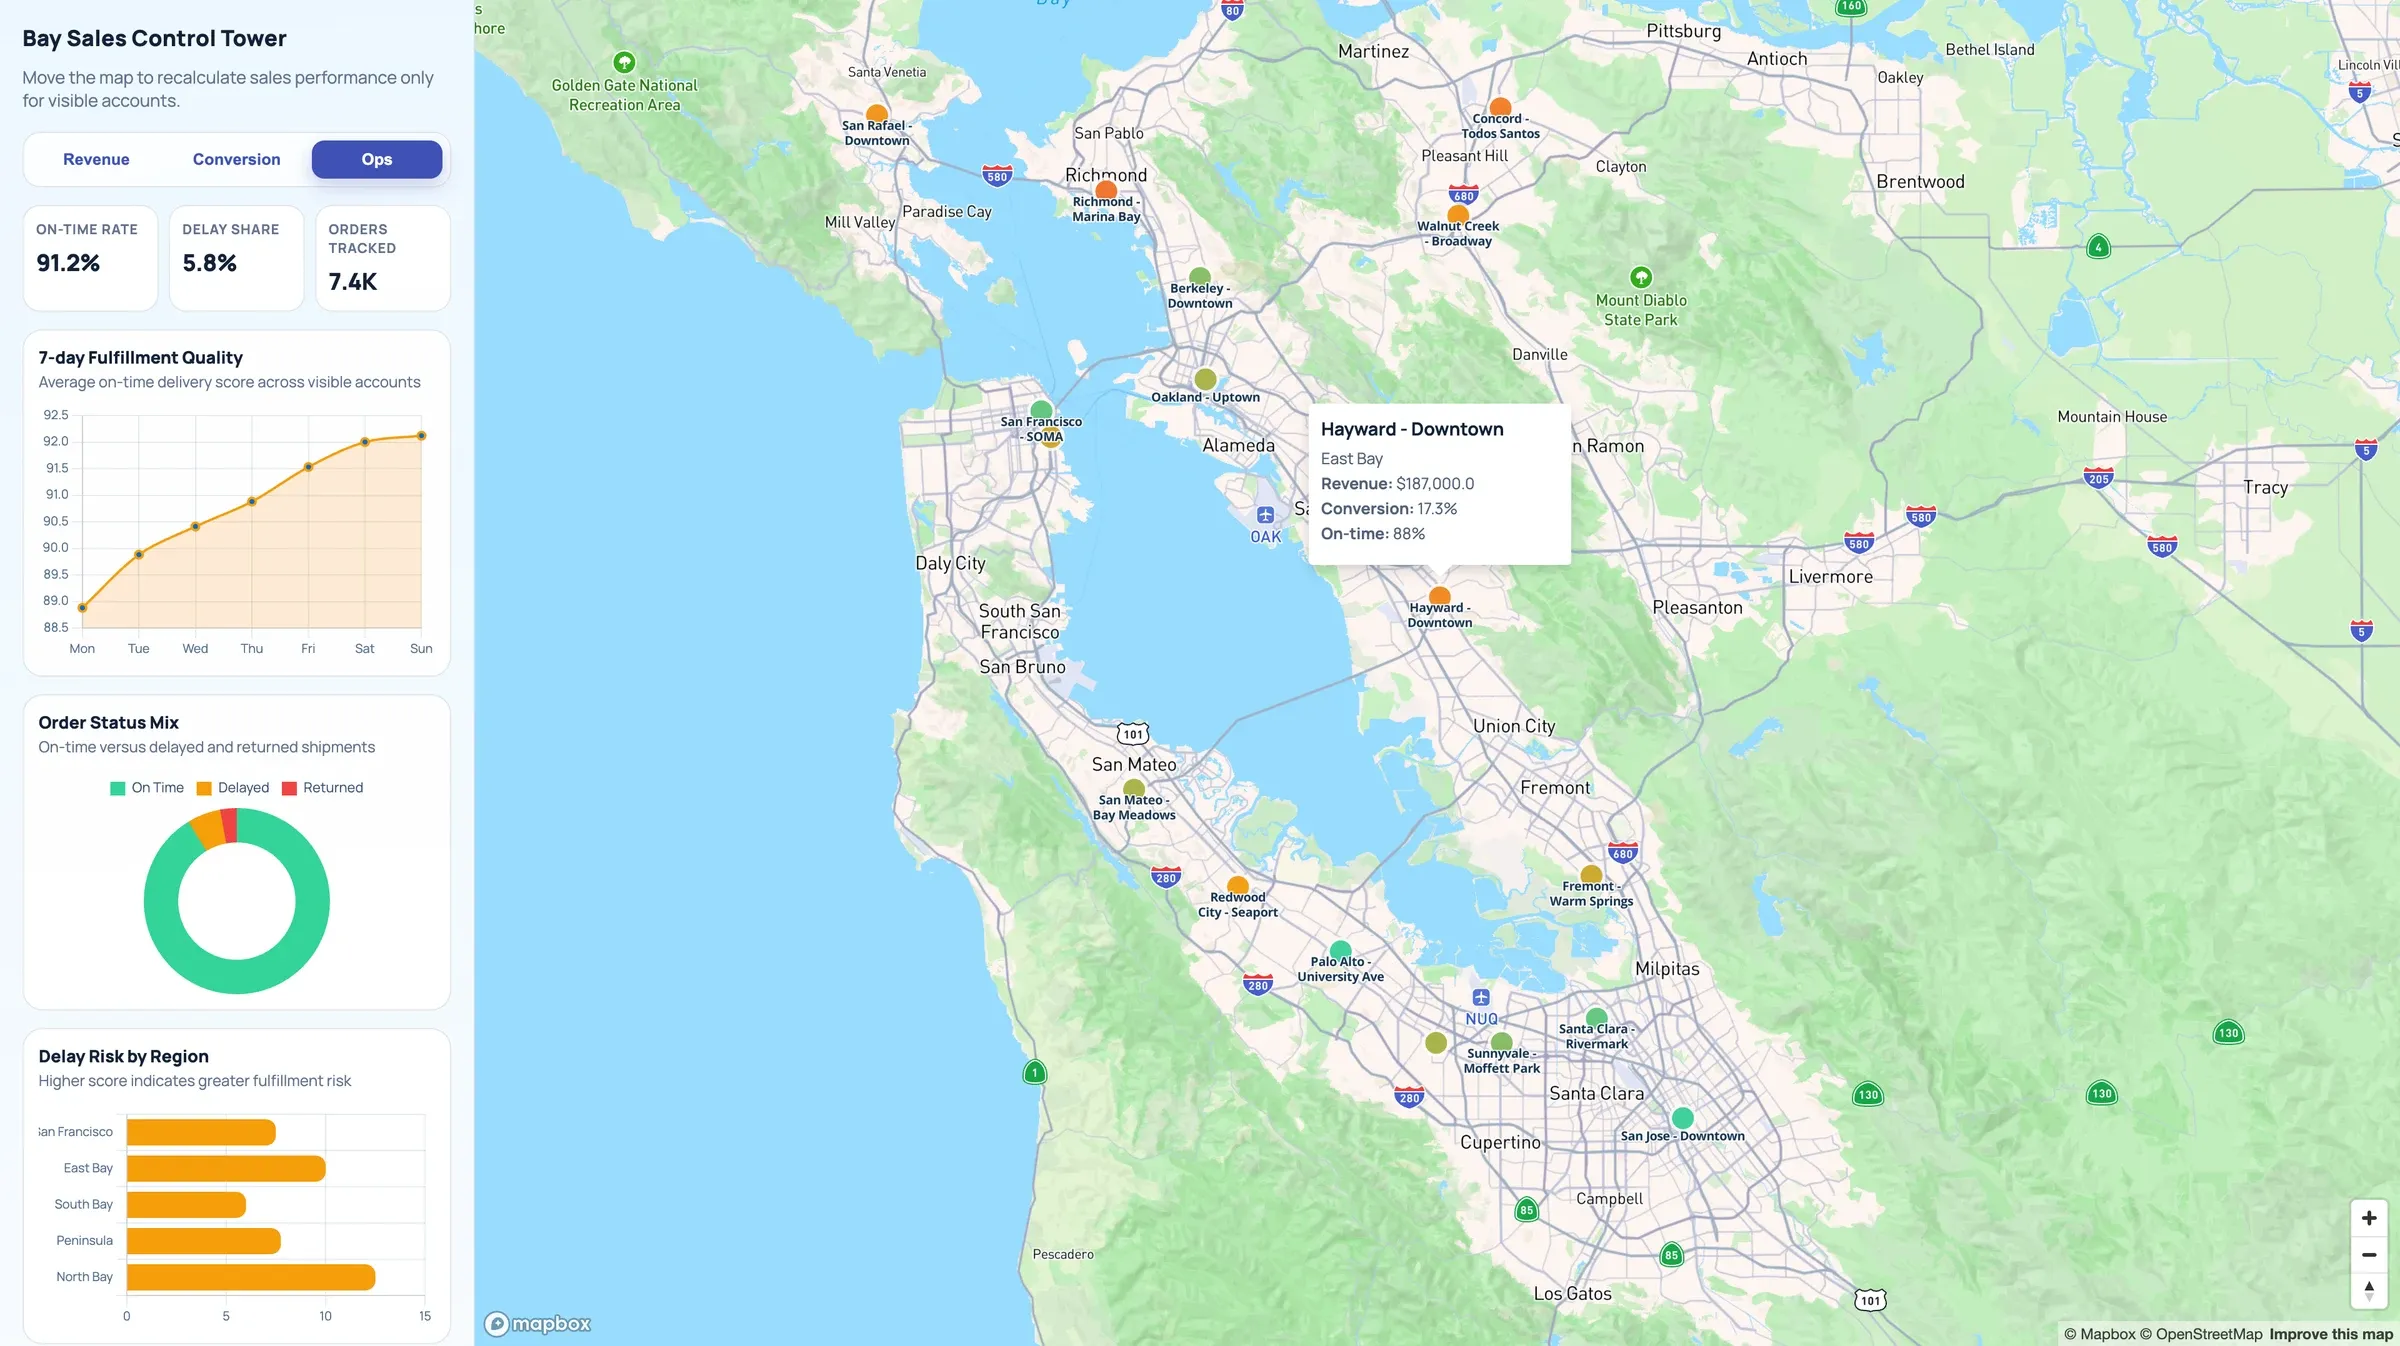 Analytics & dashboardsSales Analytics MapViewport-driven sales dashboard that recalculates KPIs for only the accounts you can see.
 -
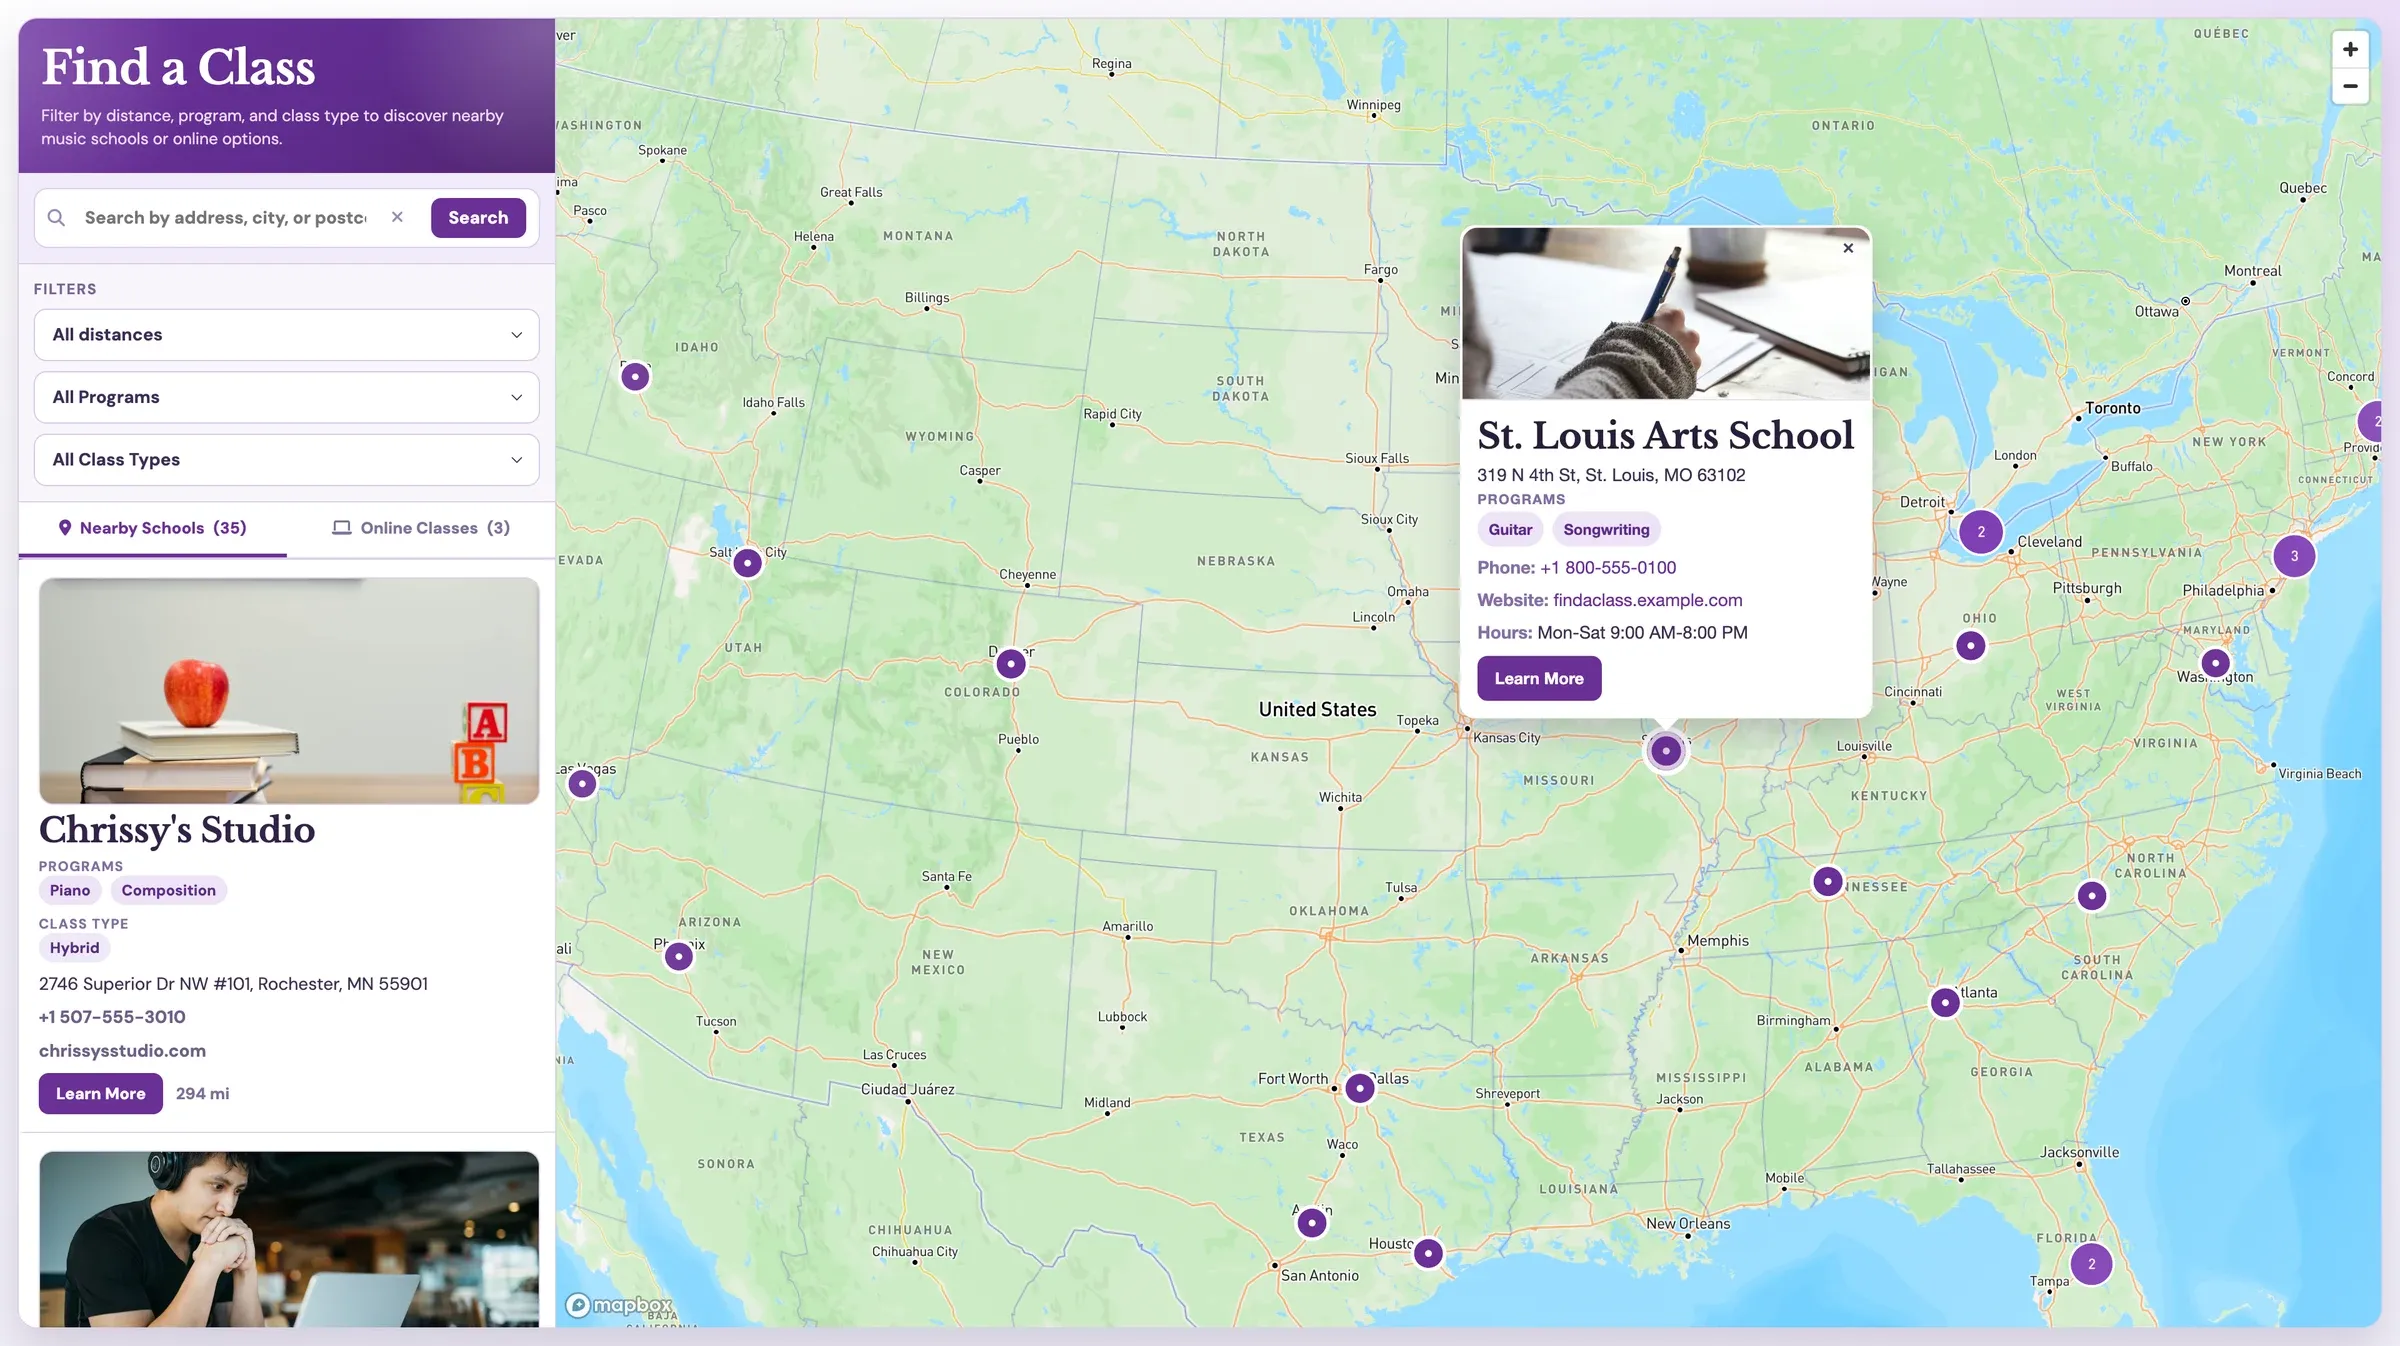 Store locatorClass LocatorClass locator for music schools and online programs with distance and format filters.
 -
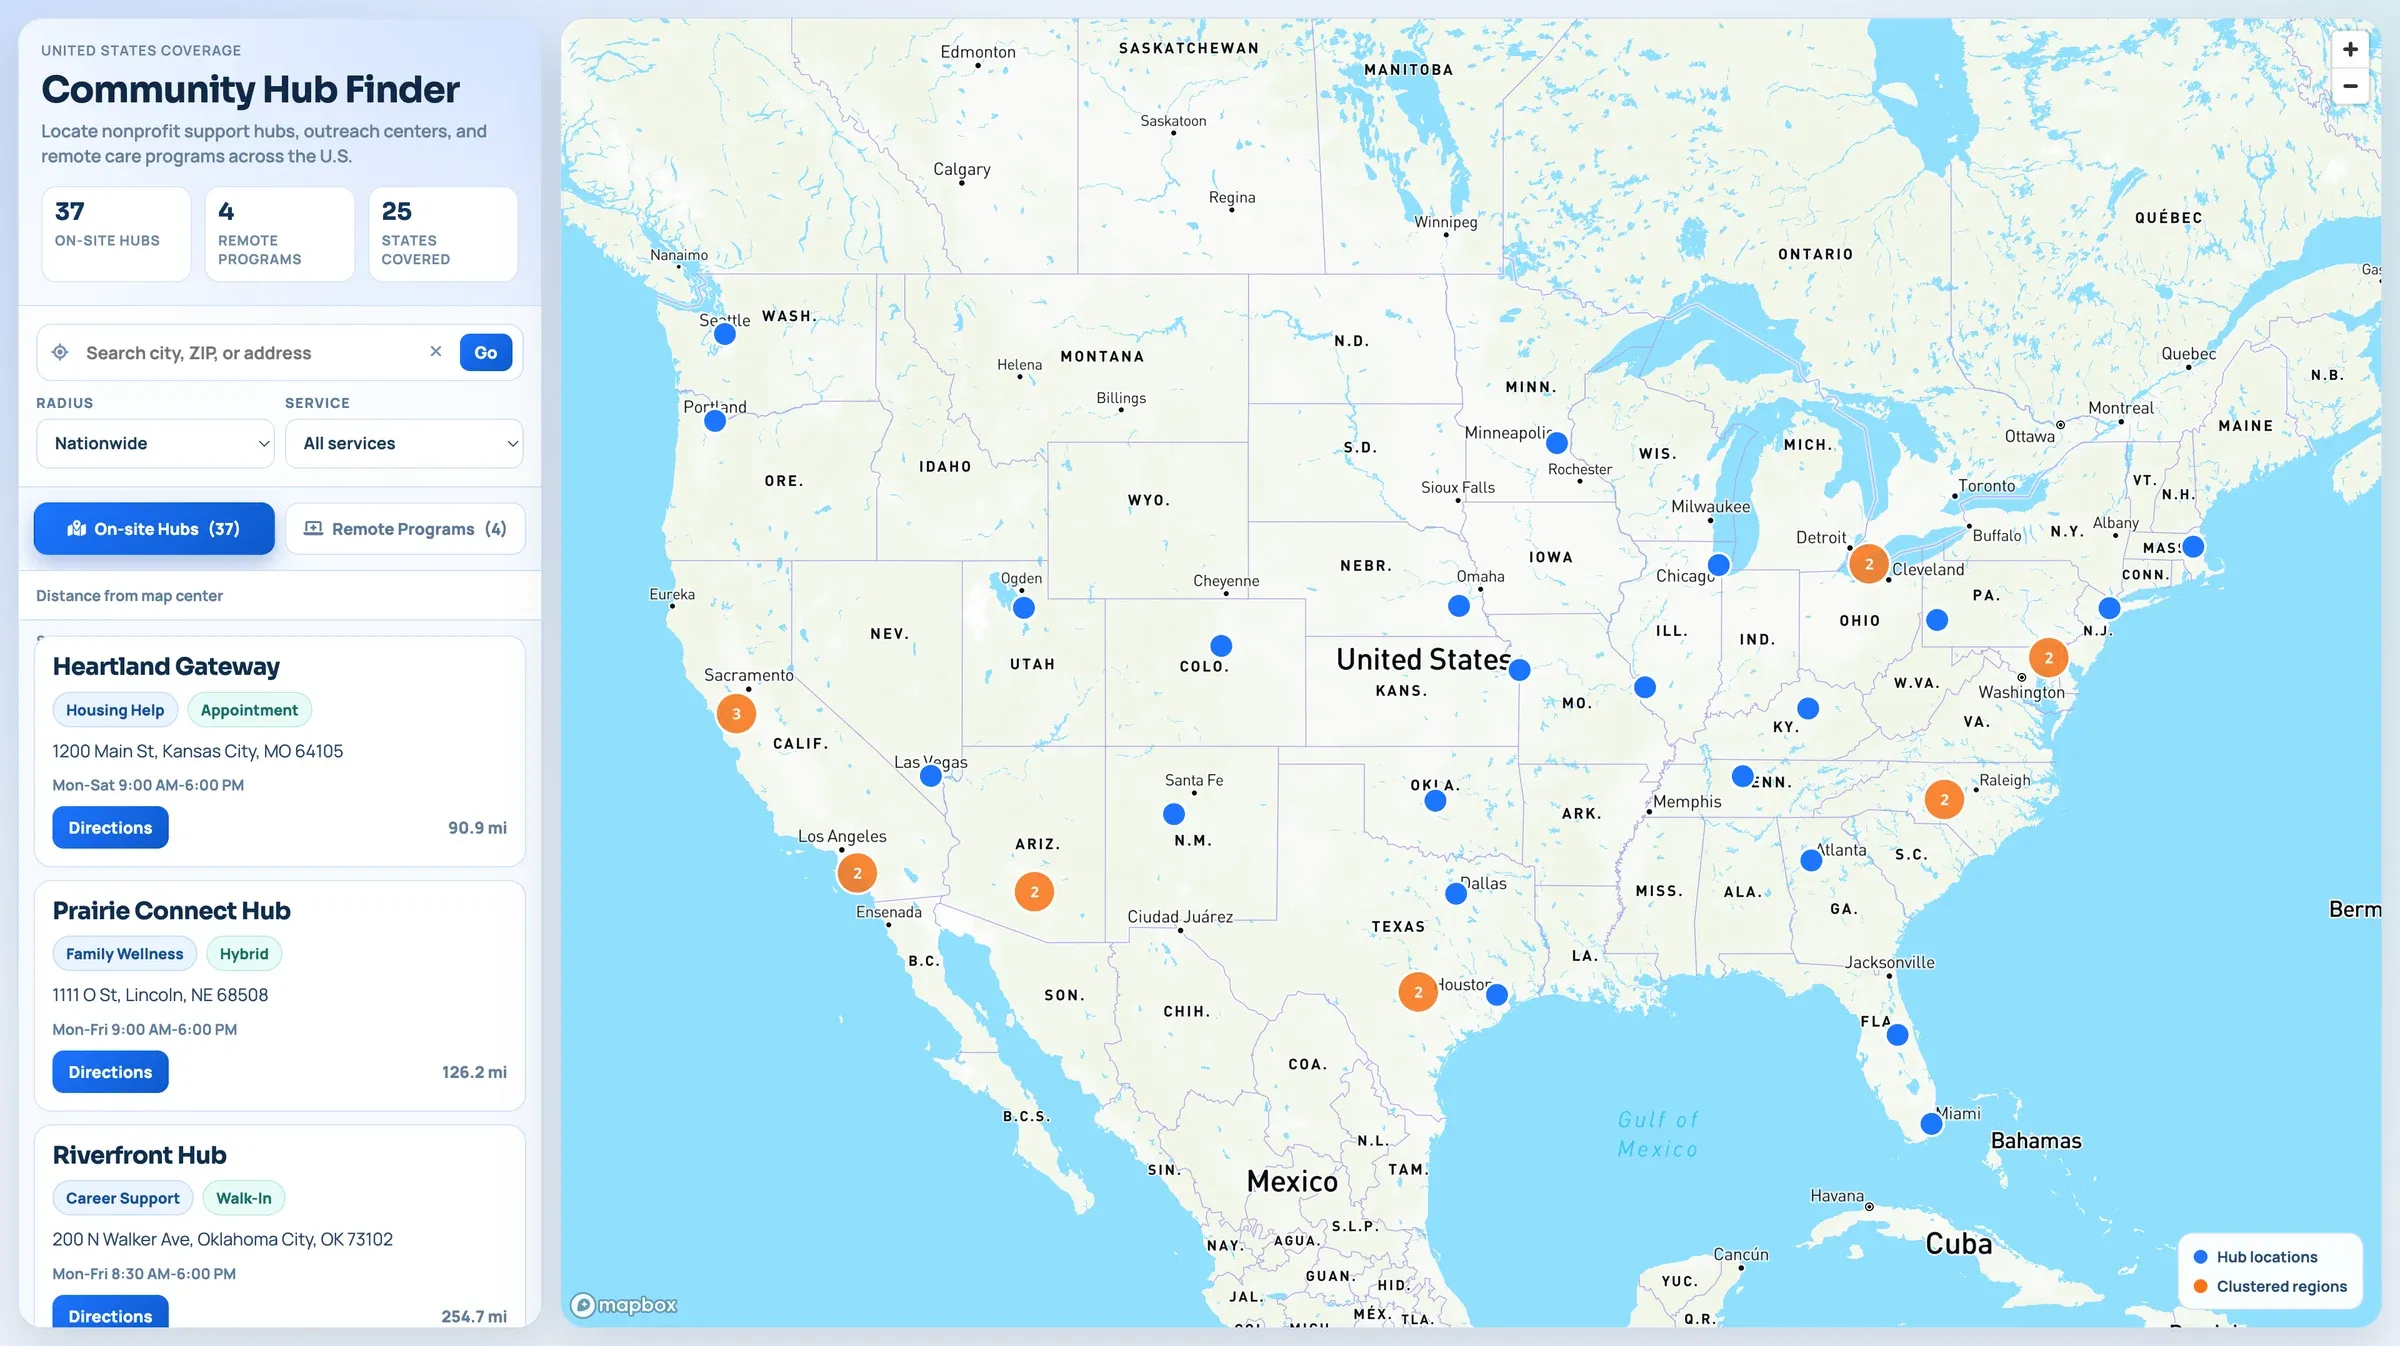 Store locatorCommunity Hub FinderCommunity hub locator for nonprofit services, outreach programs, and remote care access across regions.
Need an App Built for Your Team?
Mapsly engineers build custom maps, widgets, and tools on top of your CRM data, included in your subscription.
No credit card required · Chat with sales